IRP’s Central Texas Database
- Time:
- May 2025-Present.
- Collaboration:
- Senior undergraduate researcher on the CTX Retold project at UT Austin’s IRP.
- Tools:
- Teams, Excel, Figma. Some HTML/CSS/Java.
Development
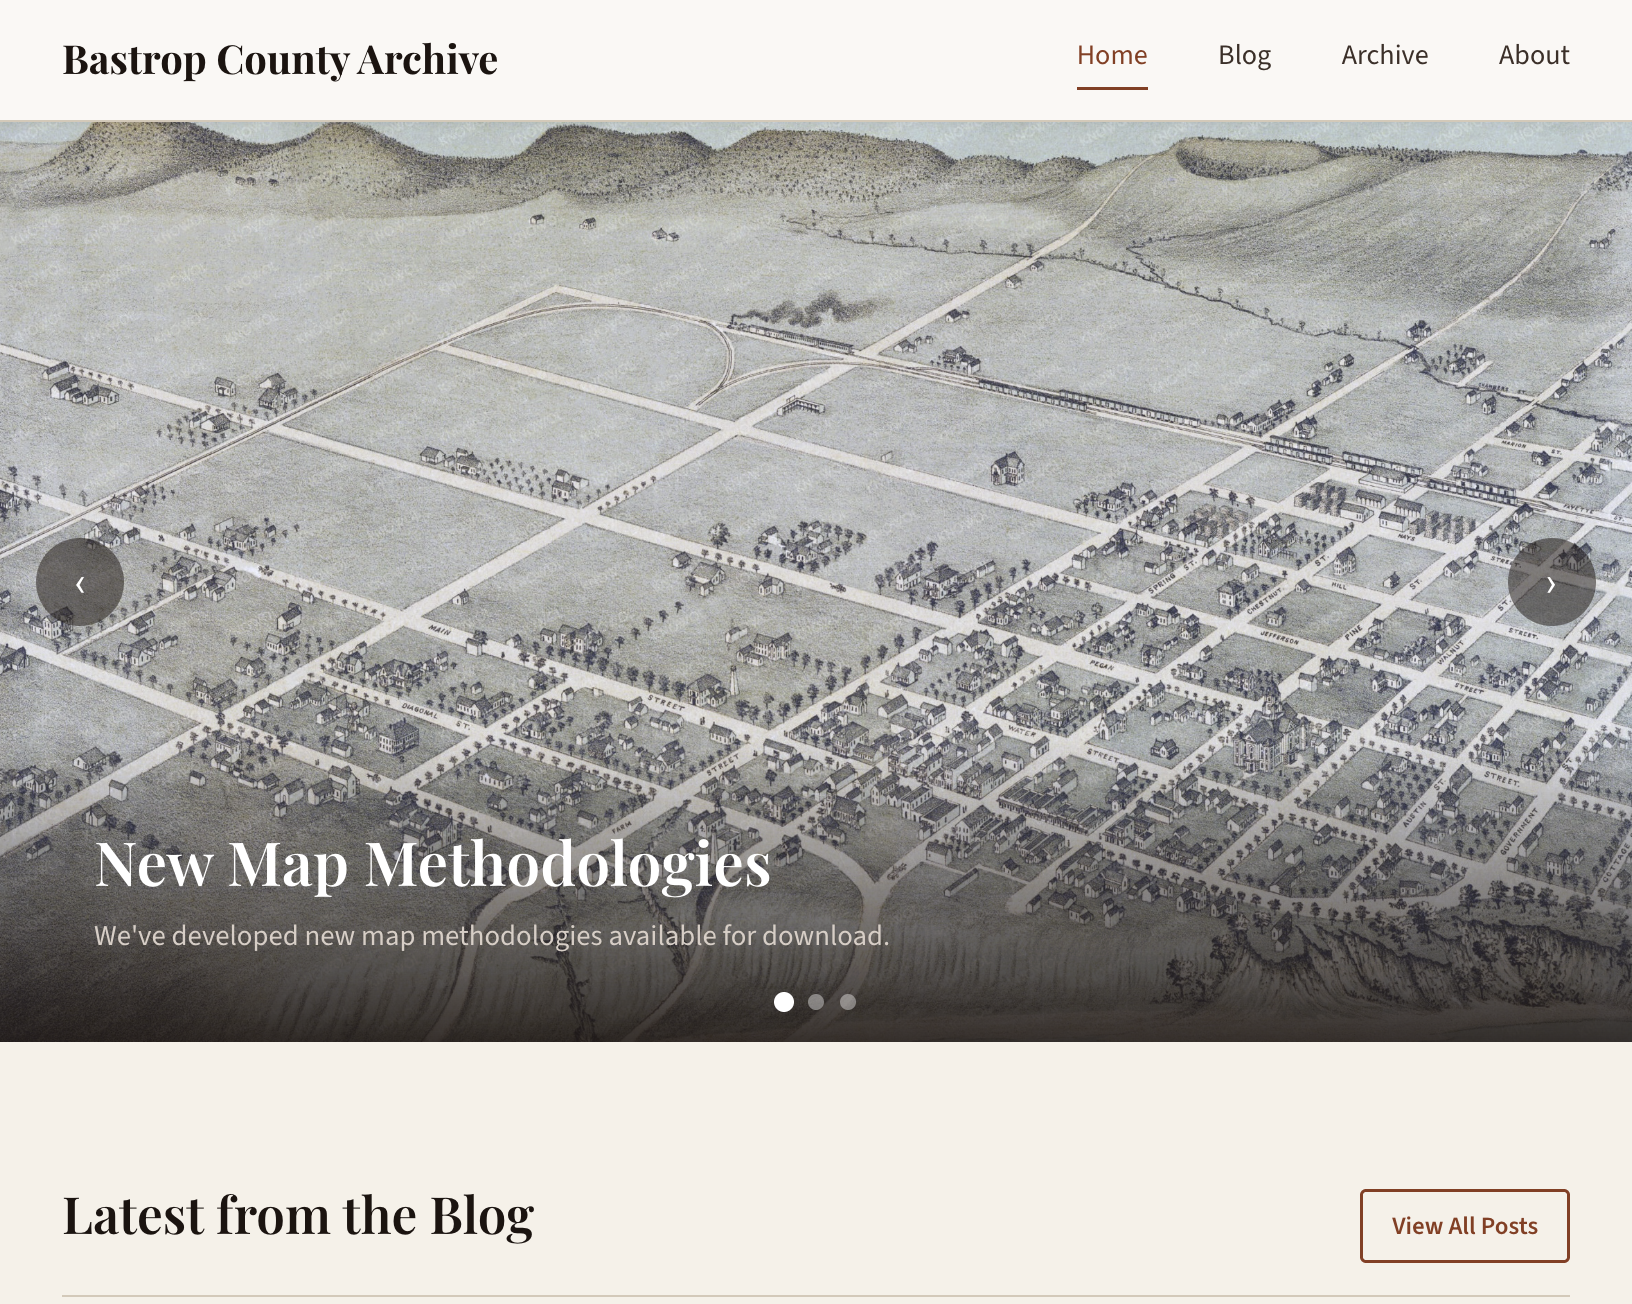
With my coworkers at IRP, I am building and designing a cloud-based textual database archive to host our Central Texas texts and formatted Census data. With this archive, we aim to support quantitative and qualitative analysis of demographers as well as local stakeholders such as the Bastrop County African American Cultural Center.
I lead frontend development of the website on a team of undergraduate AWS developers and am responsible for some of the decisions surrounding document metadata. I also lead a team responsible for the creation of GIS visualizations of antebellum slaveholder property.
The volunteer community genealogists at the Bastrop County African American Cultural Center - help to ground our project and inspired the work in the first place.
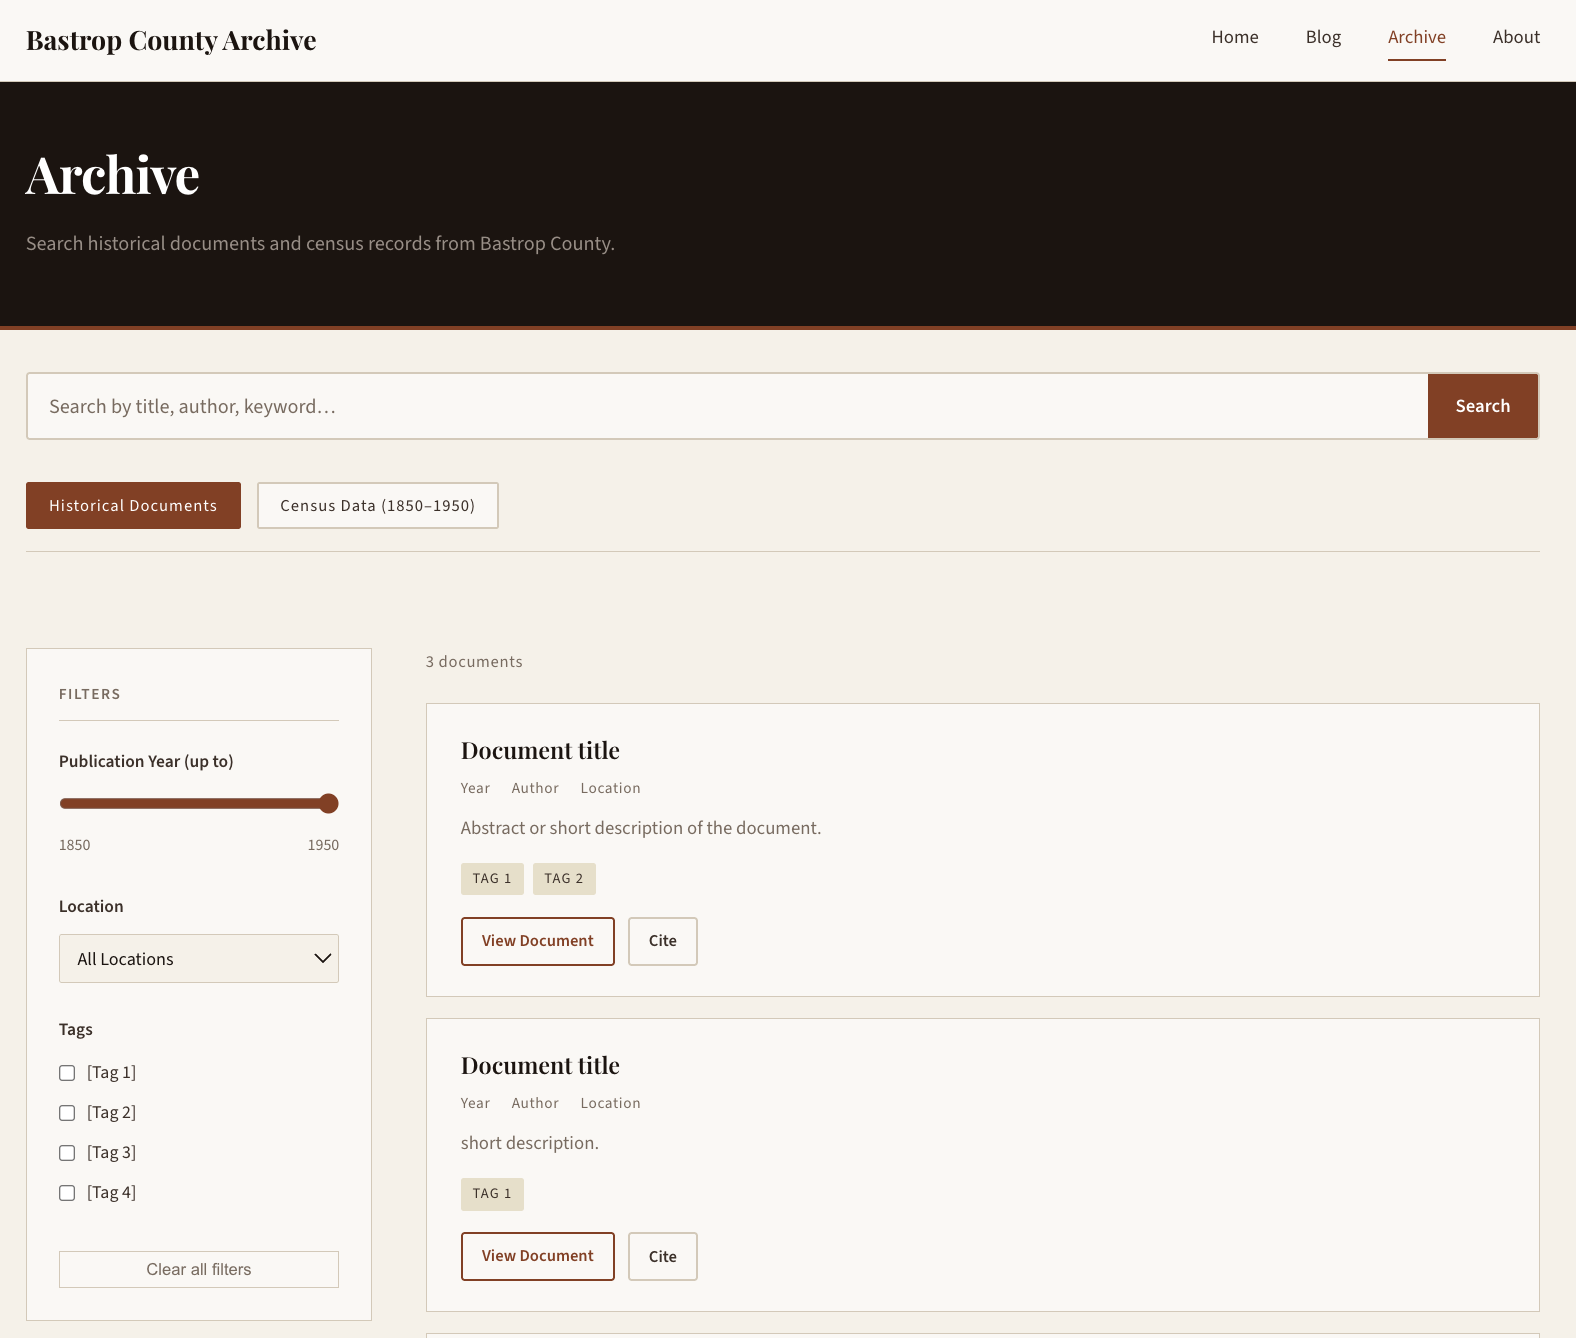
People with different levels of familiarity with digital archive search functions, from the community genealogists to the academic demographers - are both major stakeholders in this platform, and begin their search on our site with different intents. Reconciling the two was a major priority when prototyping the front end, and emerged as a flattening of the search system on the surface level. Similar to how Google’s search engine functions (but on a much smaller scale), the search feature robustness is underneath the UI in a semantic search. Thanks to Aaron Johnson and Mezmure Dawit for making this work!
Unsolved Questions
Two of the biggest challenges in the project and by far the questions we have grappled with the longest are inherently user experience questions. These questions are:
- How can we use artificial intelligence to assist us in the execution of the methodology or the presentation - whether it be through an in-house data cleaning client or a conversational user interface on the frontend?
- How do we visualize textually-sourced granular spatial data with no connection to the Census or single coordinate points?
Unlike other demographic microdata projects like IPUMS, Census data is not harmonized across time and is not flat - i.e. there are important notes in the margins, errata, and unusual 19th Century name spellings. The data’s structure - how the columns are named and the type of data within each column - varies from year to year, and it has not been normalized. Visualizing granular data, especially spatial data with evidence that only appears in textual anecdotes and offsite records, poses novel inquiries about visualization.
Workshops / Presentations
A part of my responsibilities at IRP outside of my research involve creating and teaching workshops to other undergraduates on Figma basics and design theory. I led one-on-one tutorials with students and taught lectures for research cohorts from other parts of UT’s African and African Diaspora Studies department, serving a total of 50+ students in several workshops where students gain an understanding of Figma and leave with a research poster and a vocabulary to express their aesthetic opinions more professionally.
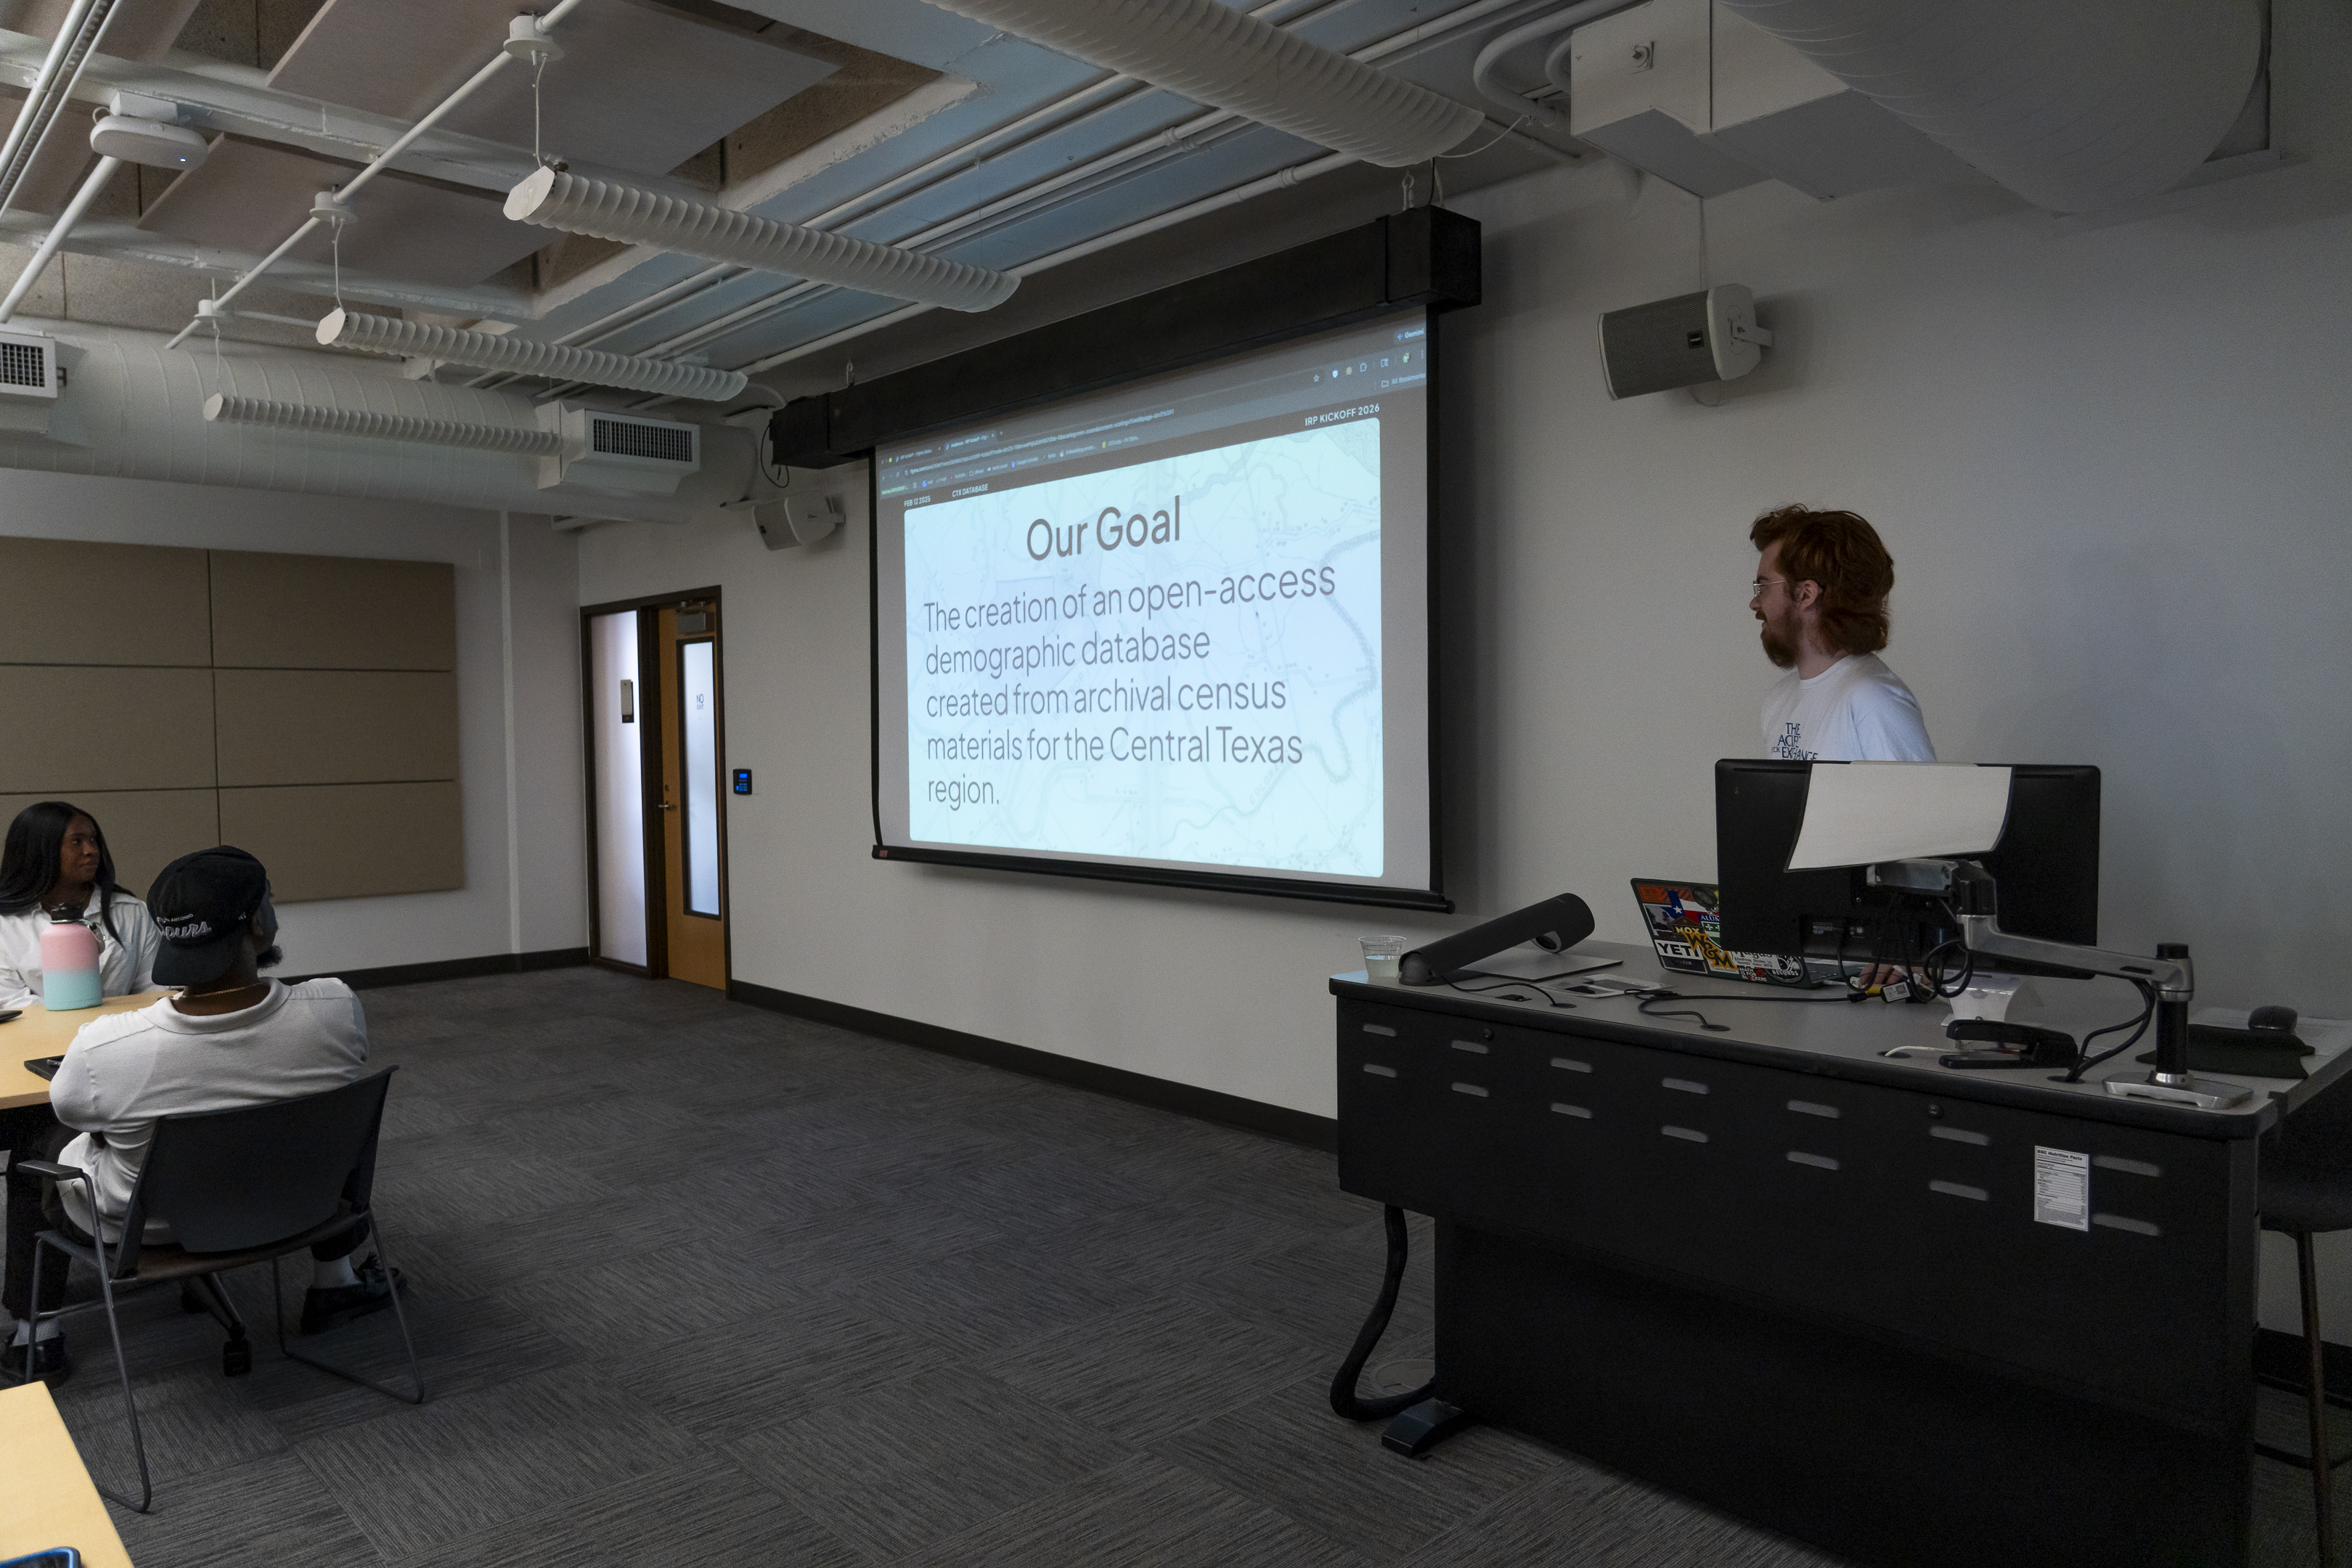
I have also been a spokesman for our research at several UT events, including the College of Liberal Arts Research Fair, the annual IRP Kickoff and a tour of the BCAACC in Bastrop County. I introduced prospective COLA/AADS students to our research, advised undergraduates in proposing new opportunities for their own independent research within IRP and trained new undergraduates on our data cleaning methodologies, improving our month-to-month cleaning output fivefold.